Data Visualization
450 years of history, 250 direct ancestors, and 1190 documents. There are many ways to tell this story, through trees, maps, document collections, photo albums, blog, biographies etc. Here are some ideas:
Hand drawn family tree
This was a Christmas gift for the family in 2020. The fan model came from the MyHeritage.com site and it shows five complete generations of Moffats and Robertsons.

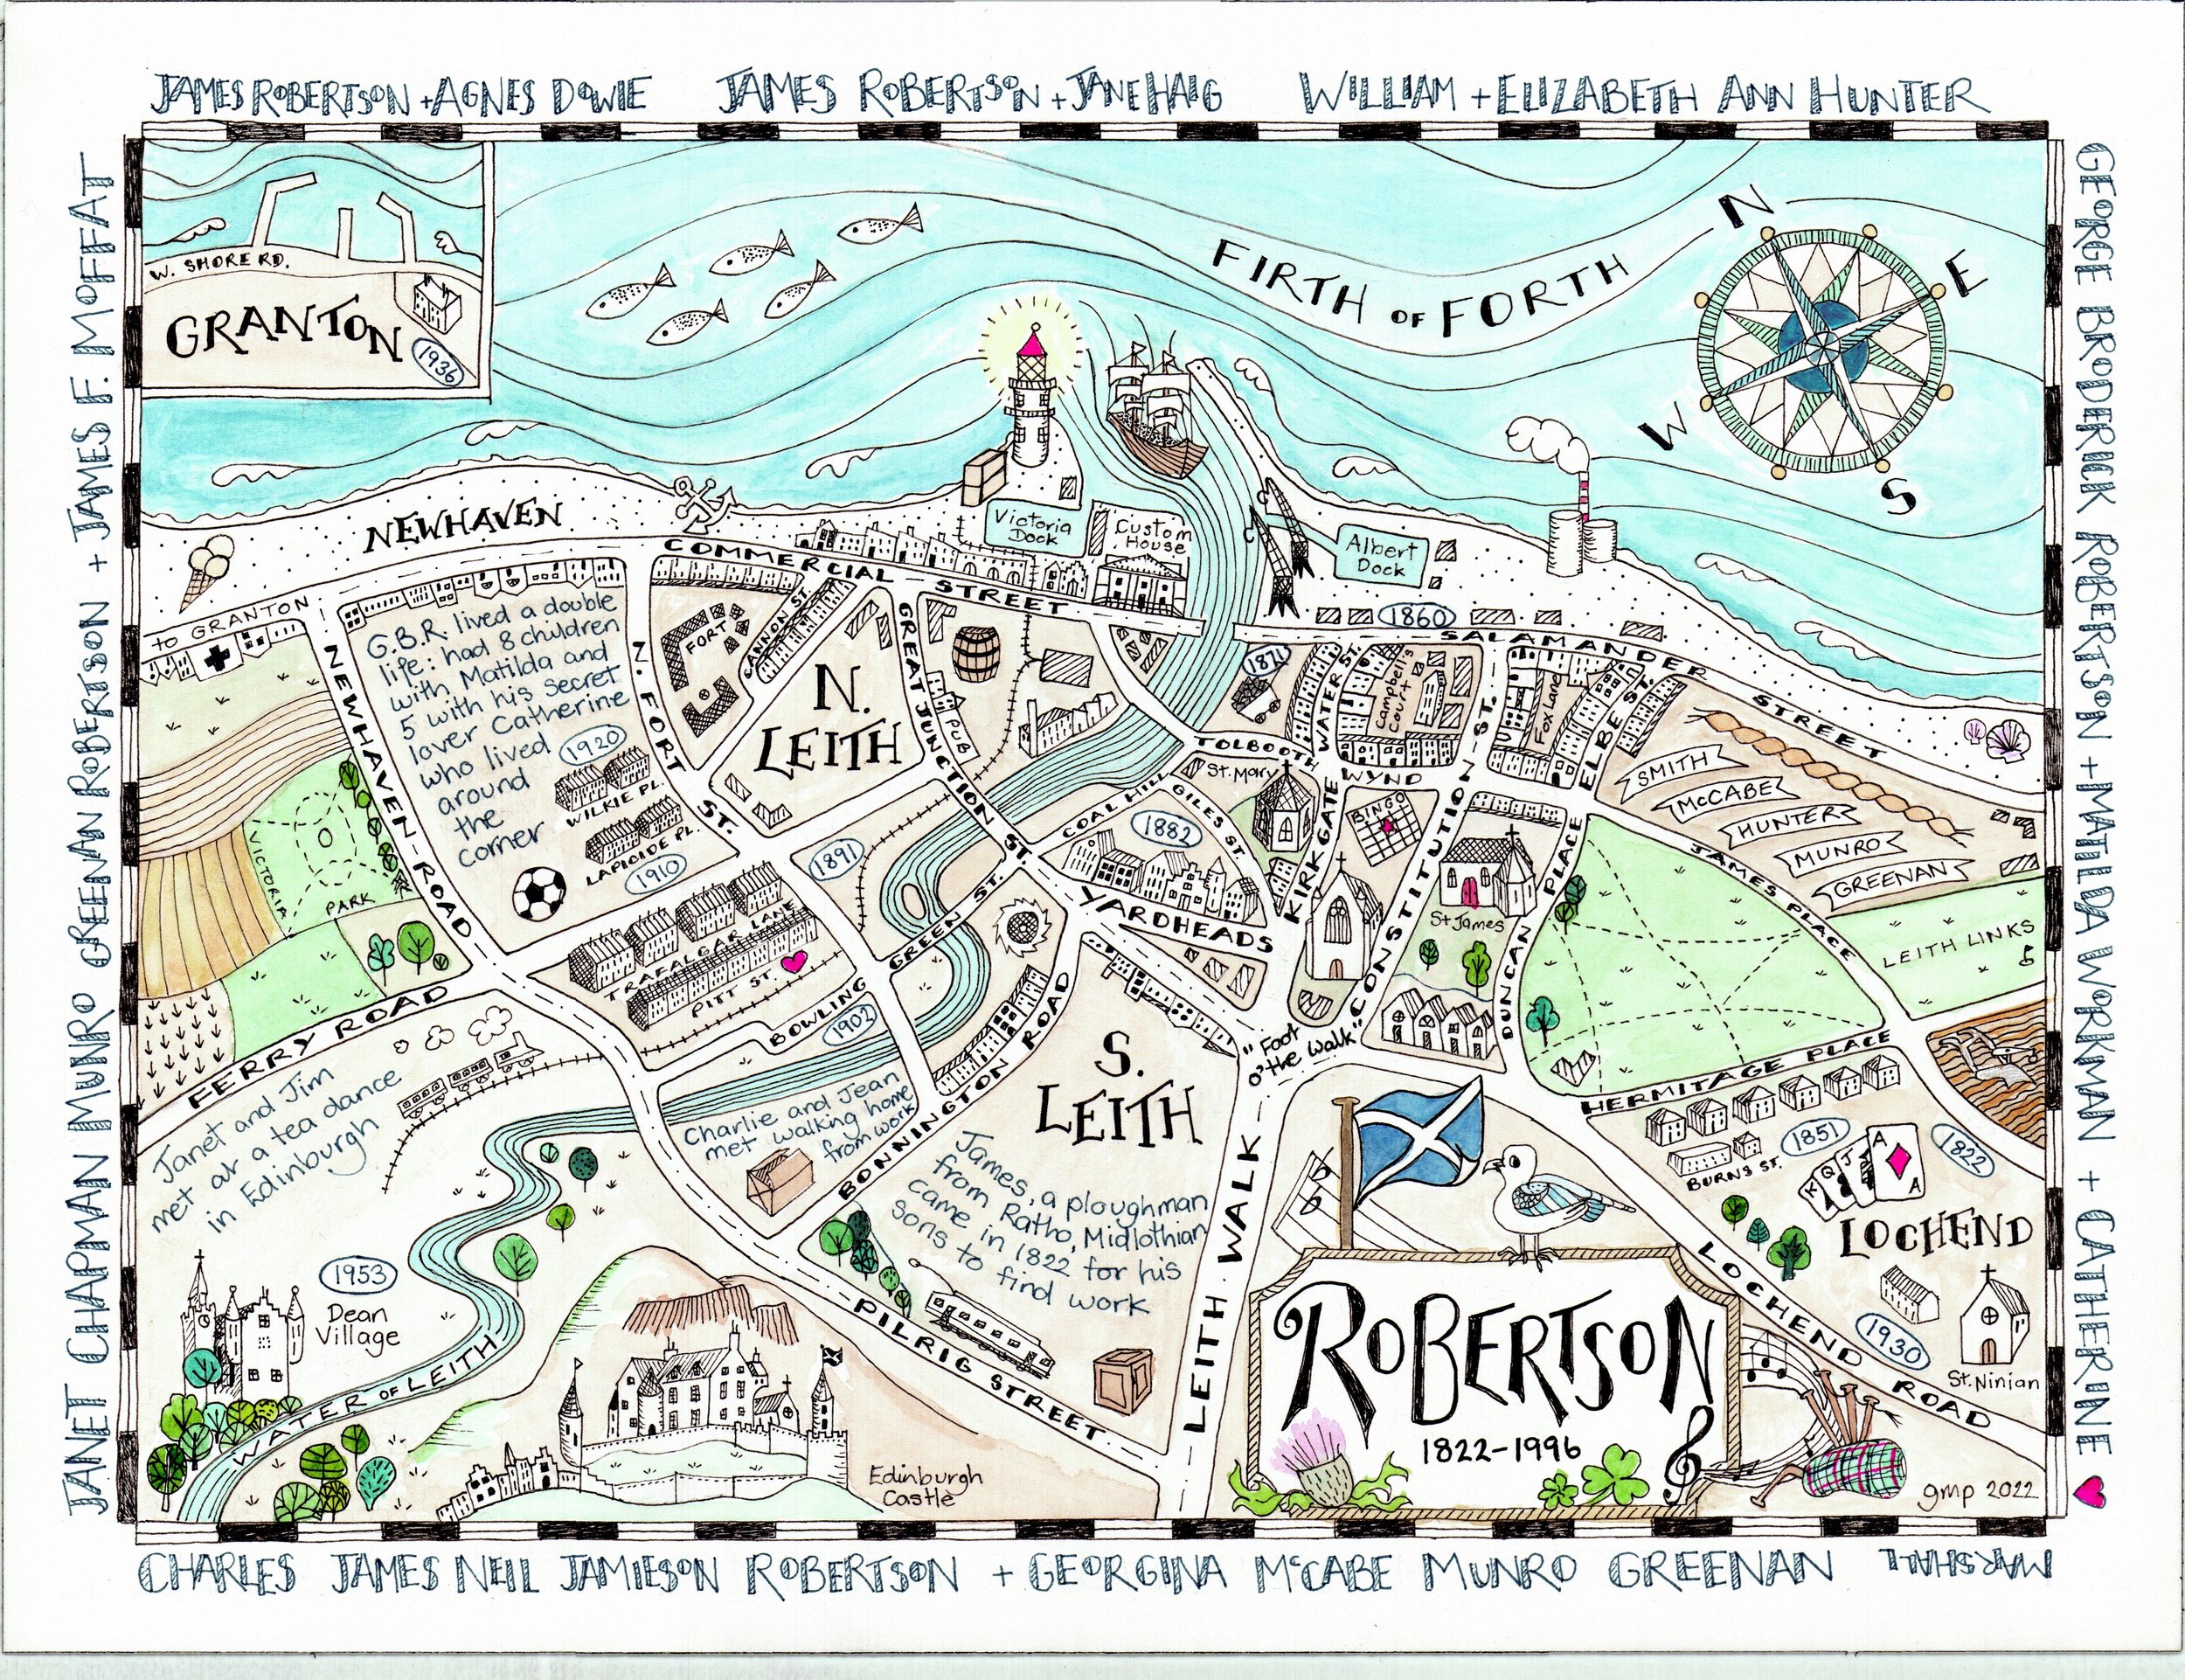
Map of Leith
This map shows the Robertson family and their ancestors from the time the first ones arrived around 1800 up to 1960 when my grandparents moved to England. For 150 years they worked. played, married, and raised their families. They started out in the crowded tenements near the docks and each generation moved out further to the growing suburbs as the Port of Leith prospered.
The map traces the six families that came to Leith and intermarried to produce my grandparents, Charlie and “Jean” Robertson.

Ahnentafel Chart
The German numbering system gives every direct ancestor a unique number. I am #1, my dad is #2, my mum is #3 etc. All paternal ancestors are odd numbers and all maternal are even numbers. By making an Excel spreadsheet using this system I can see every person on one chart, with their names; date and place of birth; date and place of marriage; date and place of death; what they died of (after 1855); and occupation.
Crosses mark if I have the actual certificate or if it isn’t available. This is the Holy Grail - I don’t add a record unless I have a proven link back to the previous generation.

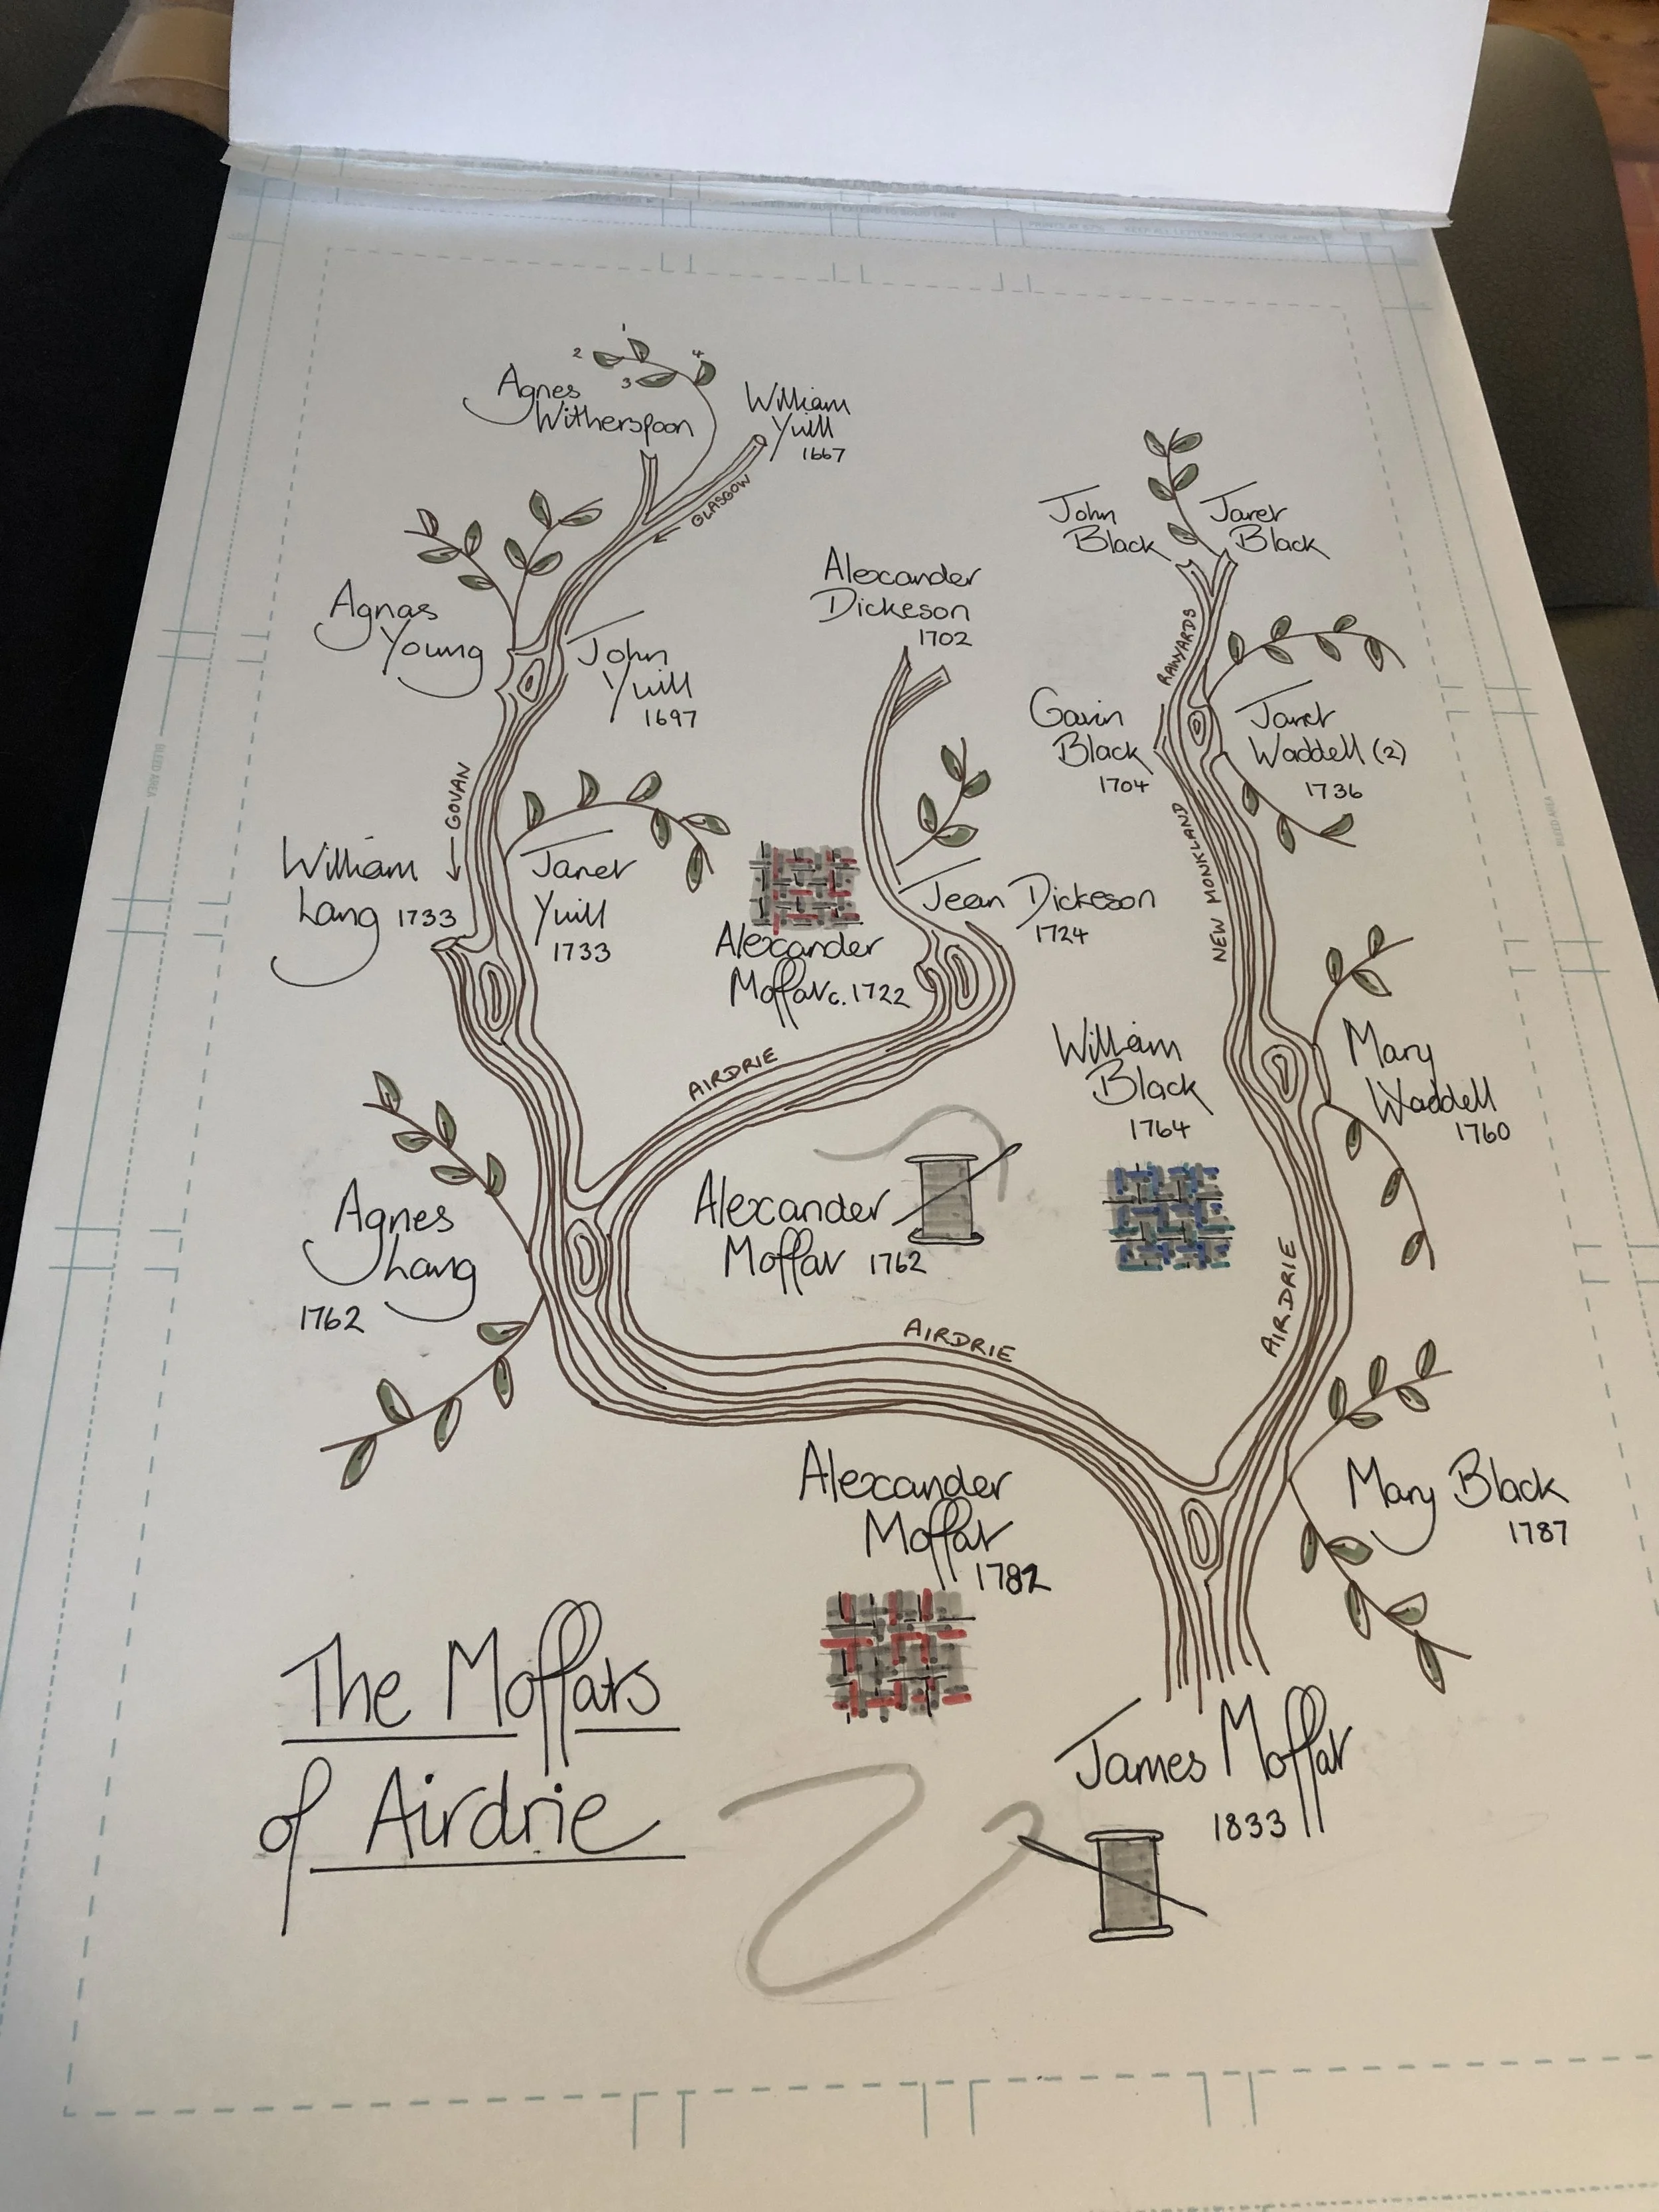
Mini Trees
Sometimes you want to do a tree by place. The Moffat family came to Paisley from Airdrie when James Moffat, a tailor moved and there and married a seamstress from Ireland.
These play trees allow me to see how families were related. I don’t complete them to frame them but rather to explore by thinking about the people as I make the drawing.
Why did James move? Most likely to be part of the textile industry centered in Paisley.

Leithers 1800-1950
Family Sibling Tree
Genealogy software doesn’t let you see siblings all at once. This tree made on Excel shows all the children of the Leith families.
Template for a Cross Stitch Tree

The Moffat tree showing 10 generations from 1700 - 2022
This chart shows all my ancestors: the four colors represent my grandparents lines: Moffat (blue); Millar (yellow); Robertson (pink); Greenan (green). Each number is the unique Ahnentafle number for an individual that represents a direct ancestor. The Robertson (pink line) goes back the furthest because they were from the Edinburgh and Inveresk area which have the earliest records. State records didn’t come into existence until 1855 - before that it was dependent on the local church parish. The Greens (green) are Irish and I haven't researched them as far back due to the poor record keeping in Ireland (and a fire that destroyed most of the estate documents).
Warp and Weft
Most genealogies follow the male lines of a family but I consider the female lines to be equally important. Males are the warp and females are the weft:

The six original Leith families in the Robertson line
Millar Tree ©
I made this tree in March 2022. It’s fun to add occupation symbols - this family was heavily into textiles - there are shoemakers, weavers, drapers, and seamstresses.

Millar Family Tree